All of the data that the dealership generates is just one click away… but if management does nothing with that information, you will be leaving money on the table. Why make that mistake?
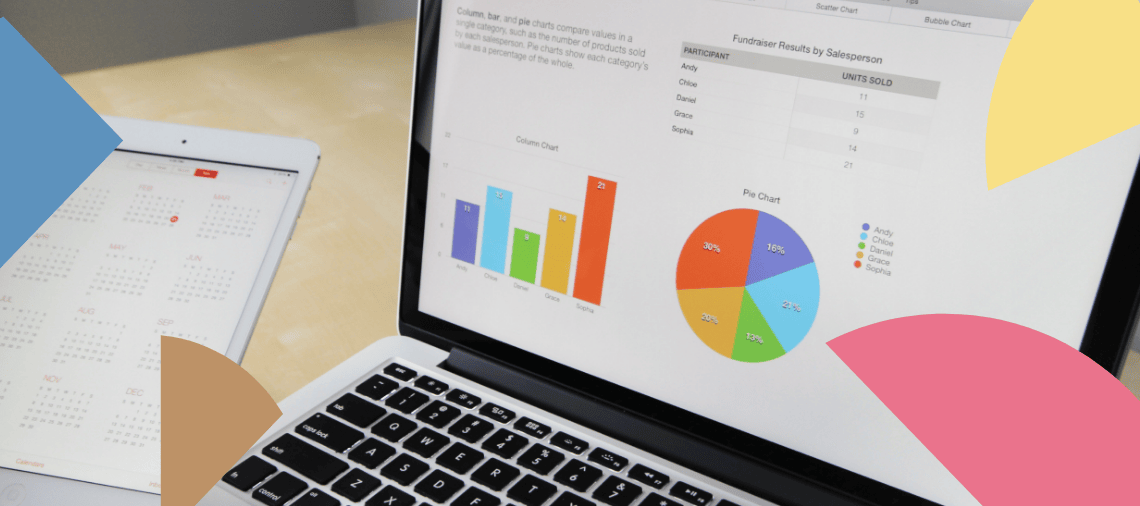

All of the data that the dealership generates is just one click away… but if management does nothing with that information, you will be leaving money on the table. Why make that mistake?
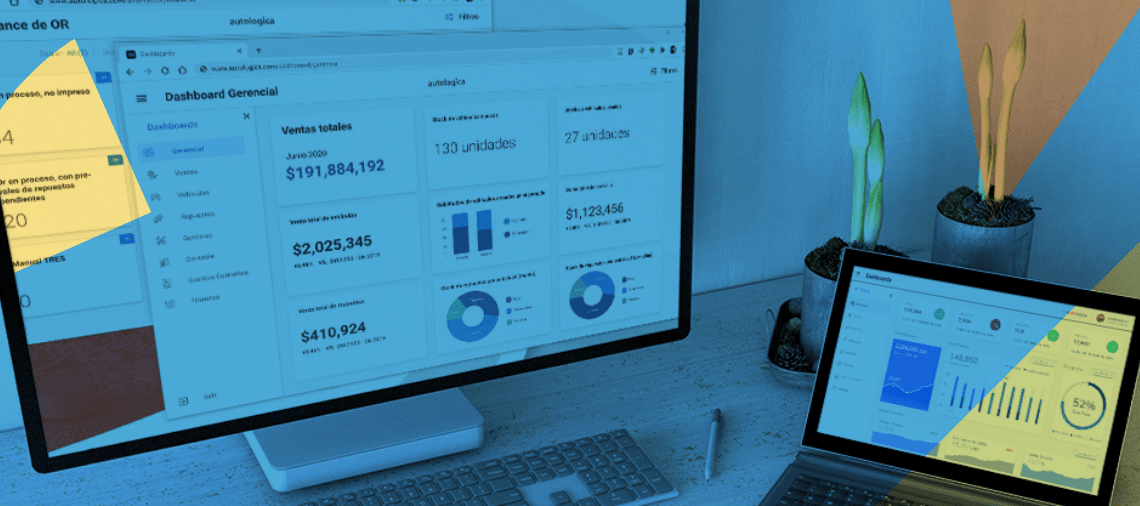
These are this year’s most-read articles on dealership KPI. In this article: Stock aging, Vehicle registrations, and Aftermarket potential per unit sold, Profit margin, Lost sales, Conversion cycle and Conversion rate, and more…
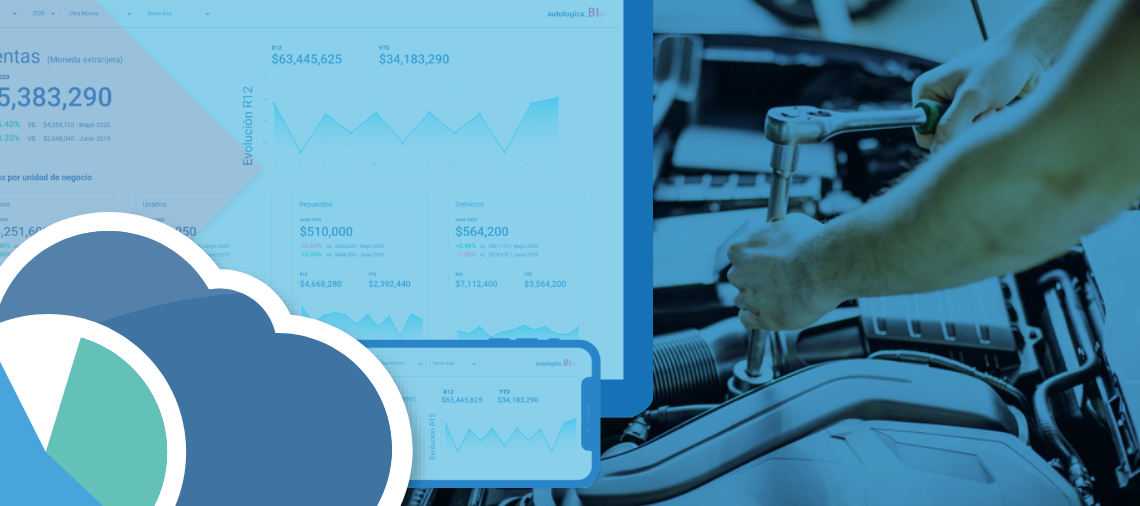
This KPI provides the Service Manager with monthly and year-to-year comparisons of the hours and amounts billed to customers for work performed by the dealership’s technicians. Information can be analyzed at the workshop level and for each technician.
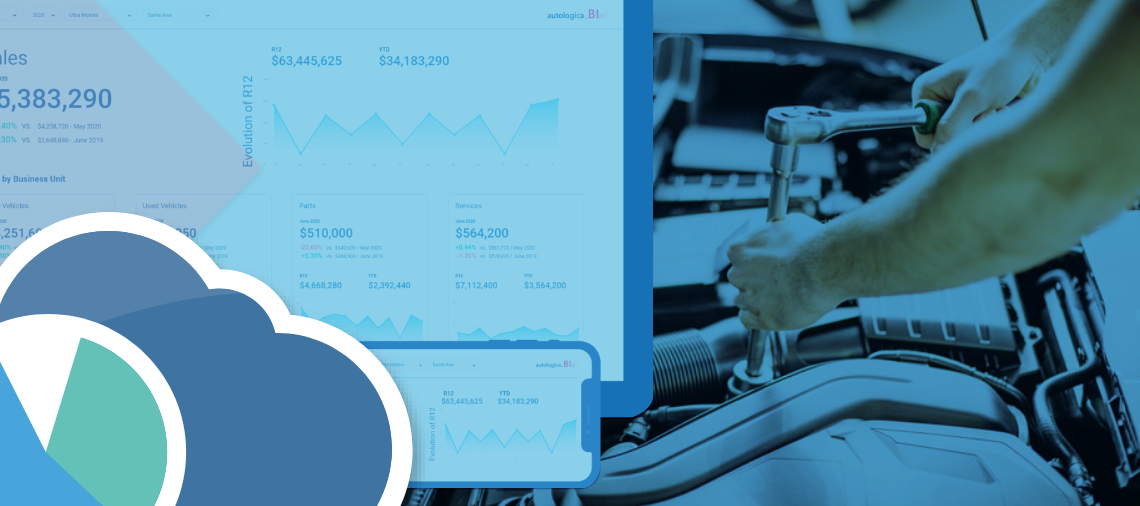
This indicator allows for interannual and monthly comparisons of the hours billed and the amounts billed in the workshop. It can be obtained both at the workshop level and for each mechanic.
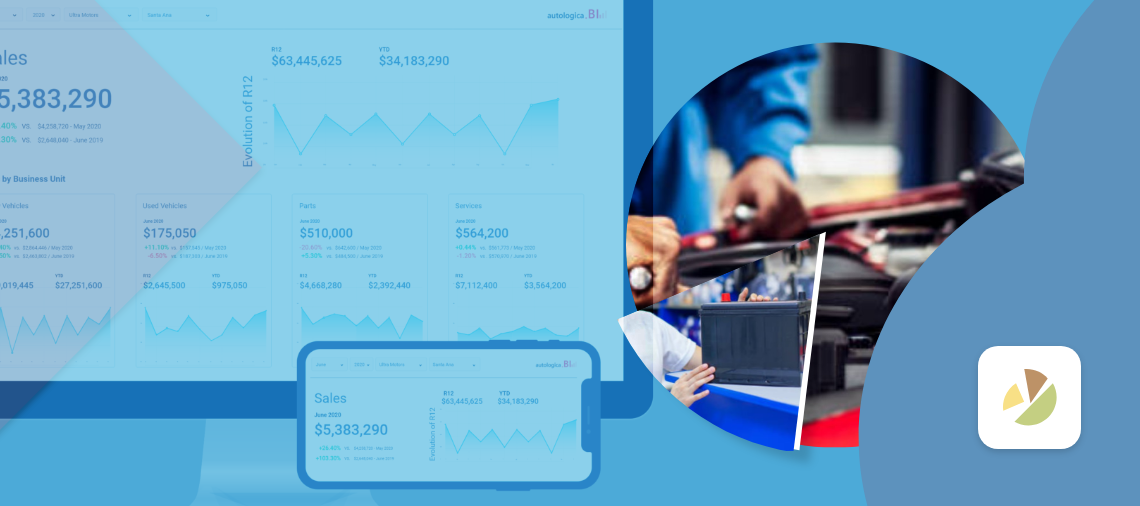
This KPI helps you analyze parts sales differentiated between internal sales to our workshop and counter sales to customers. With this information you can determine which sector drives the highest sales and profitability.
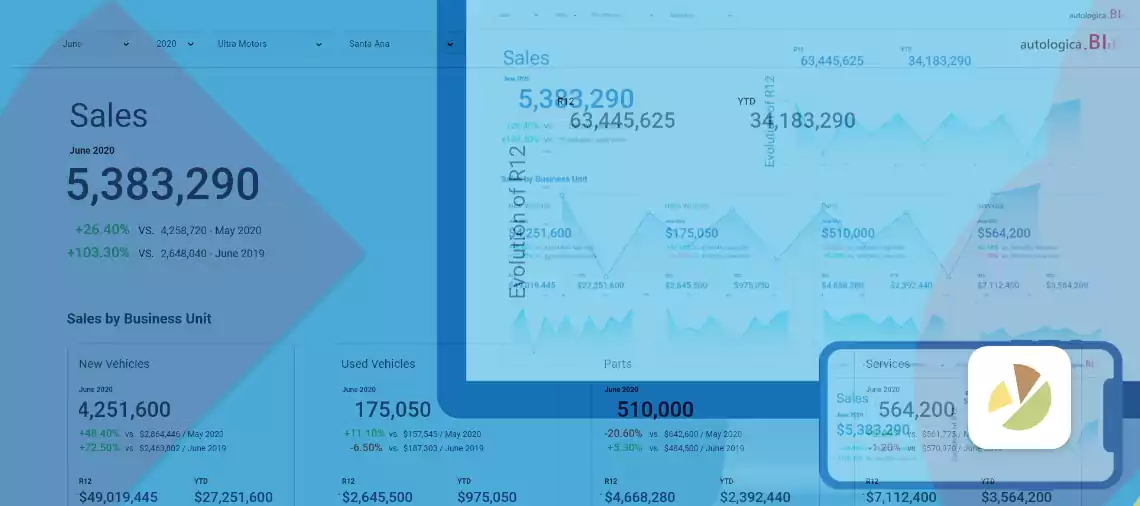
This KPI shows current sales at the dealership and their evolution. Sales information is grouped by department (New, Used, Parts, Service). Why is it necessary to measure this KPI?

With Autologica BI you can now share reports you’ve created with your co-workers, so that they can modify them, copy them to build their own reports, or simply analyze them.

Workshop indicators help the dealer detect the Service Department’s behaviors and trends, discover revenue opportunities, learn which activities are more profitable, and foresee the future of the business.
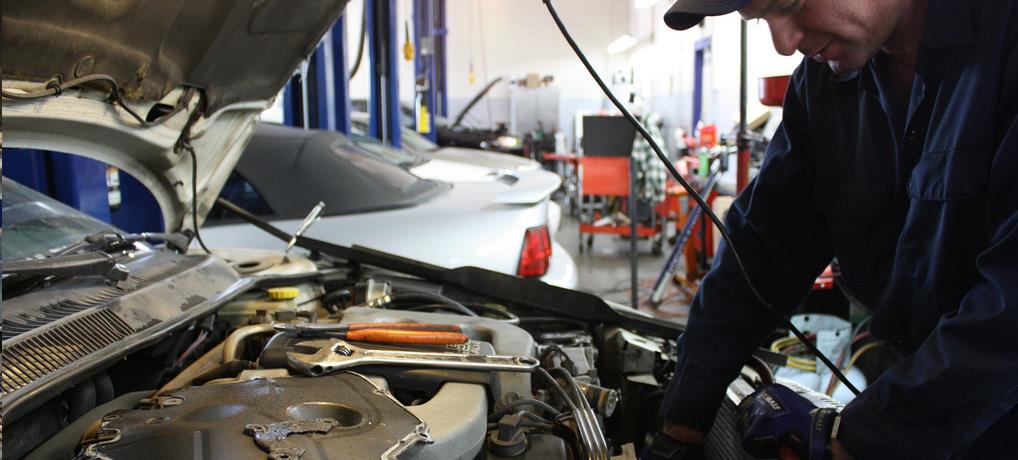
Are my technicians efficient and productive? Keeping a record of every operation in the Service Department is one of the cornerstones of successful dealerships.