This KPI provides the Service Manager with monthly and year-to-year comparisons of the hours and amounts billed to customers for work performed by the dealership’s technicians. Information can be analyzed at the workshop level and for each technician.
This indicator can be used to compare the billing levels of technicians in hours and amounts billed. When comparing technicians it is useful to also look at monthly average revenue to see who is above and below that average.
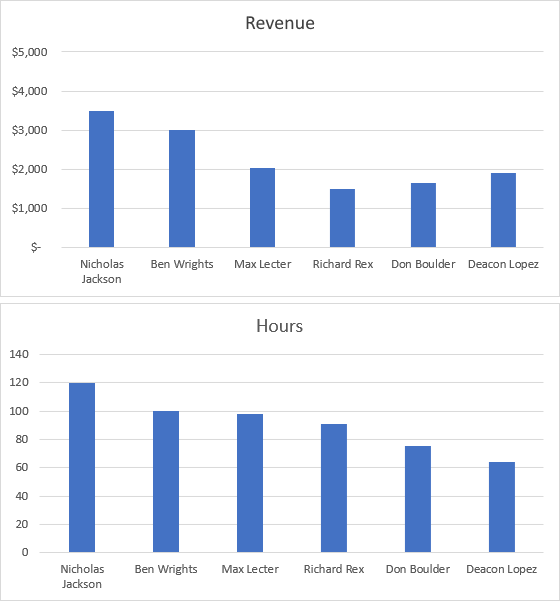
In this chart, for example, the Service Manager can see the hours billed and revenue generated for the month. With that information, they can define a baseline target for the technicians.
By reviewing this KPI periodically, the Service Manager can quickly detect which technicians are doing well and which need help to reach their objective.
Subscribe to Our Newsletter
You will receive best practices, new articles, webinars, trainings, updates and more!
» Subscribe
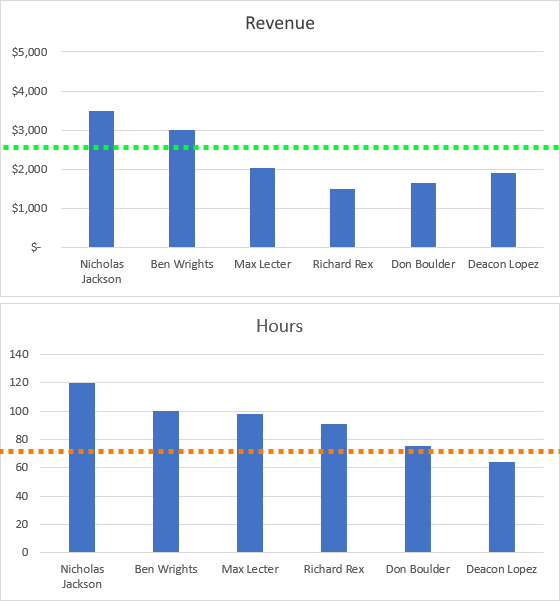
In addition to the average, a target or benchmark line can also be added to the chart; this allows the Service Manager to compare technicians amongst themselves, and also to see who is meeting their goal.
Another analysis would be to analyze is revenue is growing or shrinking; this can be done month-to-month, year-to-year, month vs. same month last year, etc.
In countries with inflation, the Service Manager can compare hours billed instead of amounts.