The combination of a powerful data tool, and the correct choice of economic, financial and sales KPIs, inaugurates a new stage where each dealership manager and principal can invest their time analyzing information and making strategic decisions.
Autologica Analytics is the evolution of a dealer management system to a decision-making DMS platform. Octavio Santisteban, one of the senior analysts behind this project, tells us about the importance of the indicators available in this new layer of Autologica Sky DMS.
Without Context, There Are Only Isolated Results
Flat data, lost on a screen, says nothing. However, as context is added, the information goes from being a meaningless number to guidance for making decisions. Let’s look at a simple example.
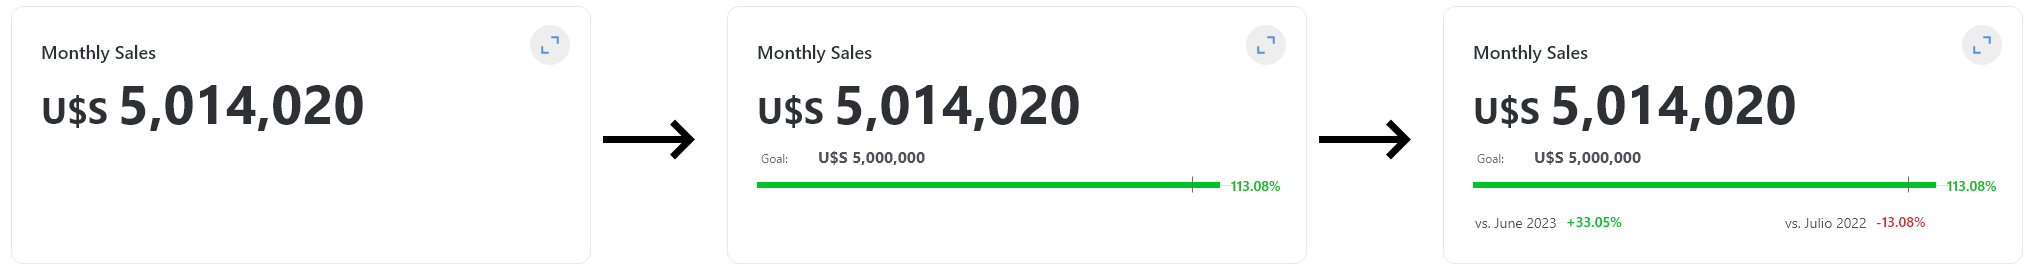
A sales KPI by itself is useful, but more meaningful when compared against the dealership’s sales goals and prior performance.
Context gives meaning to a KPI, and that’s what makes Autologica Analytics more than just a dashboard populated with indicators: it is the story behind a number that helps managers make better decisions.
At the same time, each KPI is complemented by other indicators that share the same screen space. The sales indicator shown above, for example, has greater meaning when compared against solvency and liquidity.
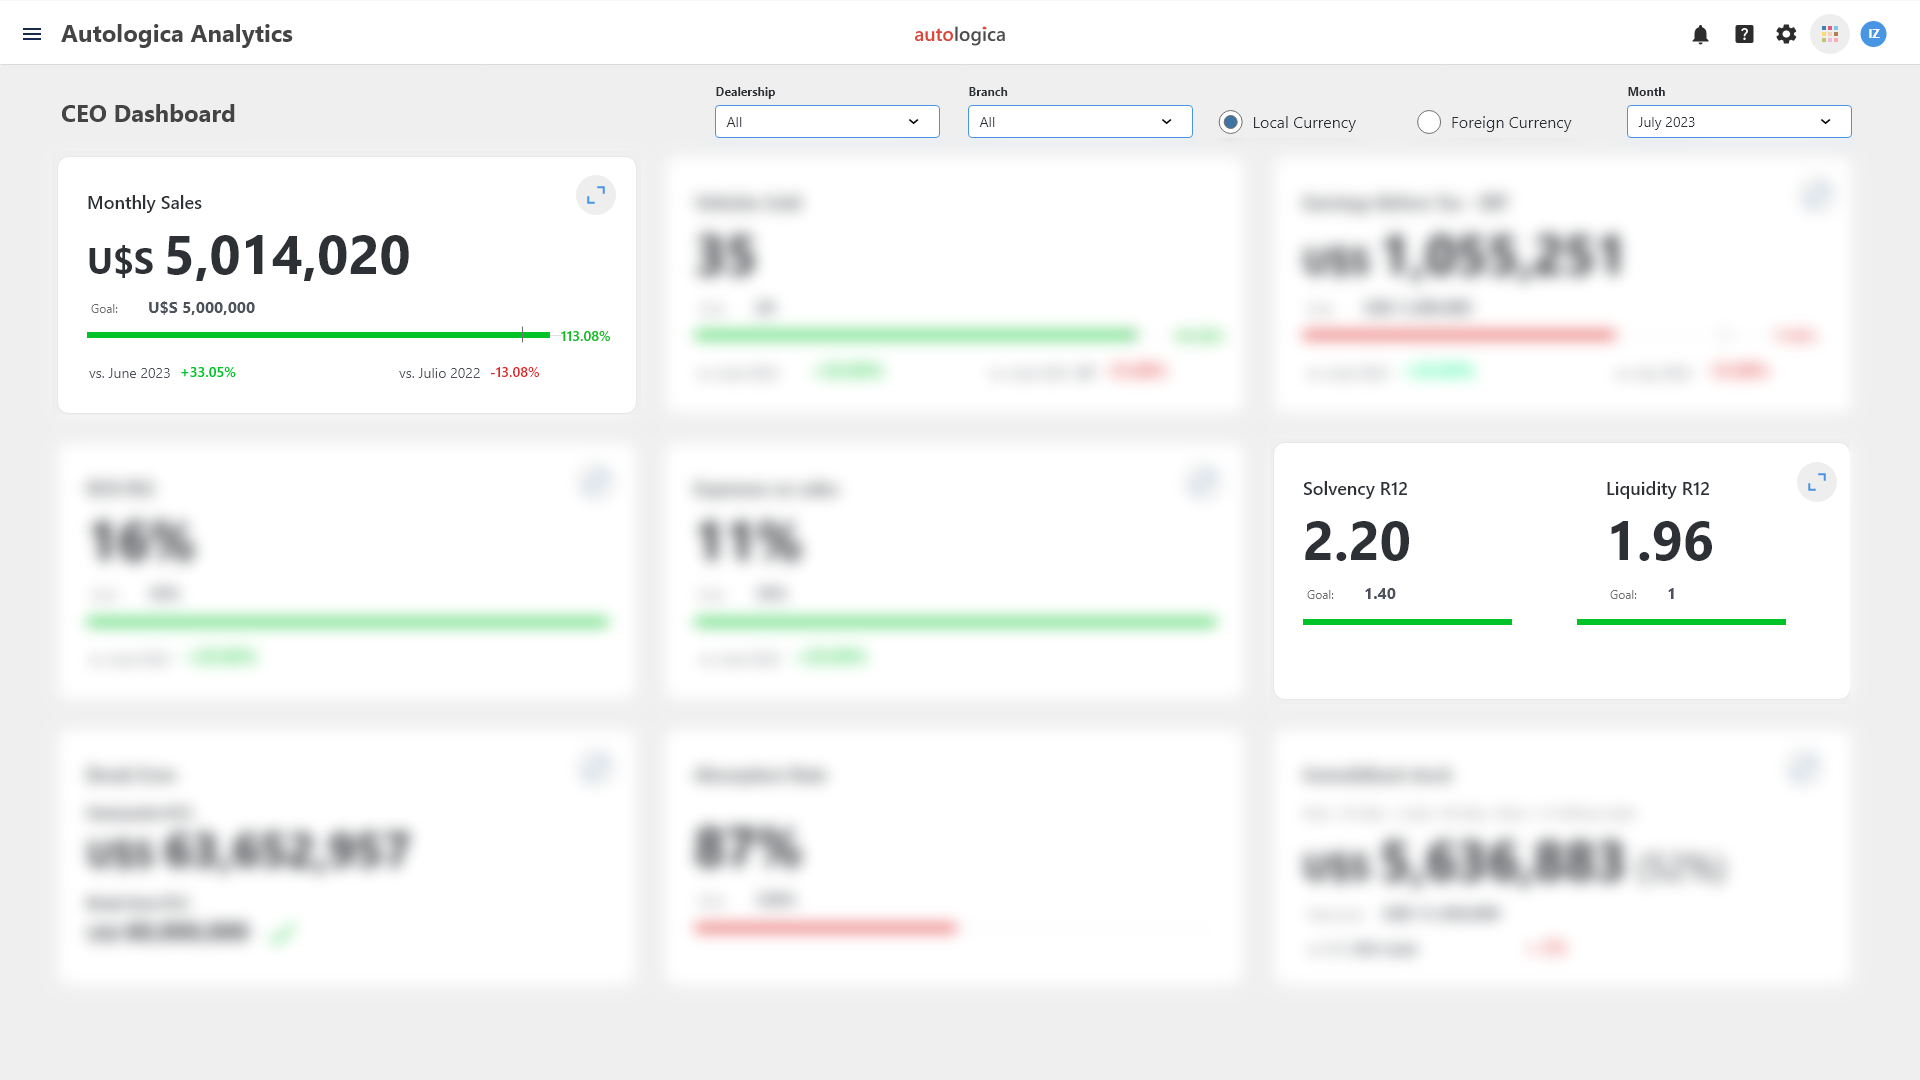
If these indicators are not measured within a context, managers can make the mistake of thinking that sales are fine, when in reality the dealership may be losing money. In this case, it is essential to analyze the indicator together with the result, profitability on sales, and expenses on sales. You may be selling well, but if sales expenses escalate to 30% or 40%, that means that more effort is being made to sell the same amount.
A similar case is when the dealership is fine in sales and is making money, but they collect those sales in 90 days, while suppliers are paid promptly. In these cases, loans may be used to pay suppliers, but in the short-term debt is generated. Solvency and liquidity, in both cases, are essential to measuring the health of the company, and to making the right decisions to avoid these situations.
Practical Case
Just as billing can be compared against expenses, the same can be done with ROS. Even if sales are fine, little may remain as profit on the income statement. For that reason, the ROS indicator helps managers know the gross for each dollar that is invoiced.
“An owner or manager will not remember if they earned $100,000 a month or $120,000, but they will remember if the ROS was 10%, and can decide if want to try to maintain that value or improve it”.
Octavio Santisteban, Senior Analyst for Autologica Analytics.
Octavio Santisteban
Senior Consultant at Autologica
Octavio counts with more than 18 years of experience working with vehicle, and agricultural, industrial and construction machinery dealers. He is constantly training and offering presentations to dealers who work with Autologica DMS, addressing key issues of each department of the dealership.
Octavio, as one of Autologica’s leader consultants and experts on the system, took on projects with dealers from countries such as South Africa, Belize, Saint Lucia, U.A.E., Colombia, Paraguay, Cayman Islands, and Nigeria.