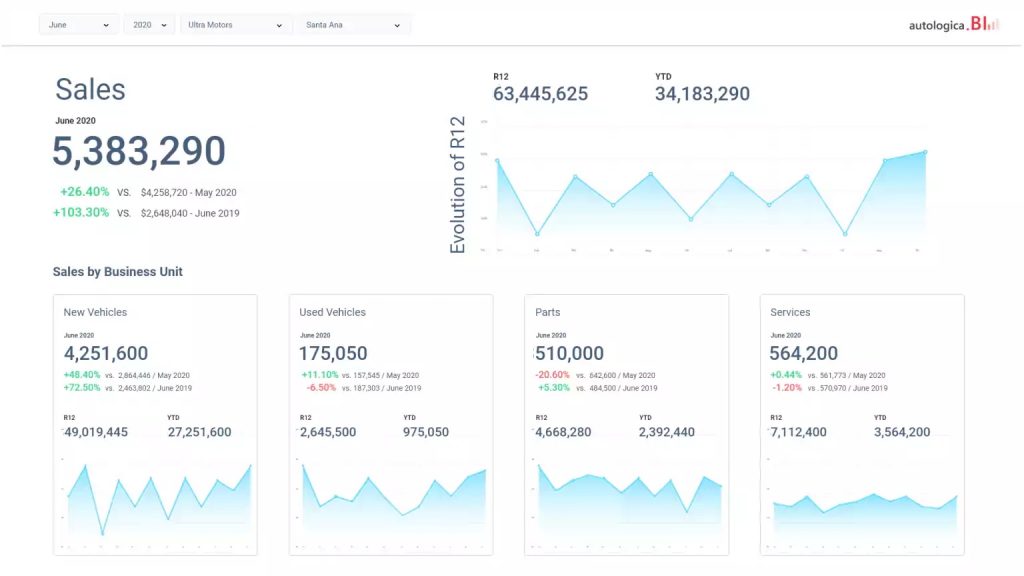
This KPI shows current sales at the dealership and their evolution. Sales information is grouped by department (New, Used, Parts, Service). Why is it necessary to measure this KPI?
This indicator shows:
- Current sales vs. previous month
- Current sales vs. same month previous year
- Rolling 12 months
- Year to date
By analyzing the evolution of sales over time we can discover periods of higher and lower revenue, in order to make strategic decisions.
Tip: Total Sales can be viewed in local and foreign currency.
The Importance of Analyzing the Past, Present and Future
Data analysis tools help us make better decisions by letting us review the past, act on the present, and predict future behavior. With this premise in mind, the Total Sales KPI becomes the starting point for strategic analysis.

Do you know Autologica Sky DMS?
Autologica Sky DMS is a software for the automotive and machinery industry with all the functions and integrations that professional dealerships need.
» Request a demo
How to analyze the past, present and future using this KPI
The past | By being able to see how this KPI fluctuated in previous periods, you can begin to see trends and behavior in the form of plateaus, increases and drops. The analysis of the past is useful to avoid (or to take advantage of) situations that occur repetitively.
The best way to use this information is to ask yourself, for example: why did sales peak in certain months? Why did sales start to decline after a certain month? Why are peaks sometimes followed by resounding drops?
The present | In the past you had to wait until the end of the month to find out how the business had done. Today, real-time data technology eliminates uncertainty. Daily data helps us make quicker corrections.
For example, if the dealership’s monthly parts sales goal is $500,000 and at mid-month you see that you have not reached 50% of that, you can quickly implement changes.
The future | By analyzing the fluctuation of an indicator over time, you can identify patterns. For example, if there were sales peaks in May of the past three years, you can assume that in May of this year it will happen again. In addition, by looking at our sales history, we can make sure we have the right inventory for expected future sales.


