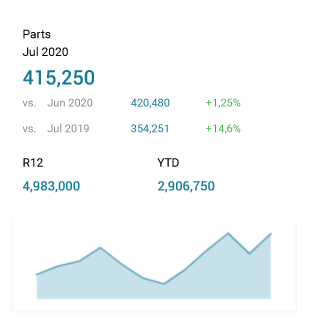
This KPI is essential in order to understand the dealership’s monthly parts sales and their evolution over time; this includes both counter sales and sales to the workshop. This KPI can be displayed in local currency and in foreign currency.

One major feature of Autologica BI is the possibility of delving into each piece of data to see more and more detail, without having to wade through multiple spreadsheets or cross-reference information. By simply clicking on a piece of data, you can drill down from the general level to finer and finer detail.
A Practical Example
Let’s say parts sales for July were $415,250, which was an increase from the previous month and also from the same month last year. At first glance this seems like good news, and that there is nothing to improve. However, drilling down may show something else…
- Total parts sales | $415,250
- By sales type:
- Workshop $311,437
- Counter $103,813
- Counter sales by customer type:
- End consumers $29.906
- Workshops $73,907
Do you know Autologica Sky DMS?
Autologica Sky DMS is a software for the automotive and machinery industry with all the functions and integrations that professional dealerships need.
» Request a demo
Seeing this, the Parts Analyst (who knows who the main customers are) drills down one more level to and detects that a major customer did not buy any parts in July.
- End consumers | Tom Richards | May: $8,451
- End consumers | Tom Richards | June: $1,520
- End consumers | Tom Richards | July: $0
With this information, the Parts Analyst can advise the Parts Manager to contact the customer and discover if there is a reason for the drop in sales, and to try to recover the customer.


