Autologica Analytics is transforming how dealerships use their data—making it easier to analyze information, increase sales, make better decisions, and implement strategic actions.
To continue enhancing this powerful KPI analysis tool, we’ve added new dashboards that focus on sales management and profitability analysis for each vehicle transaction.
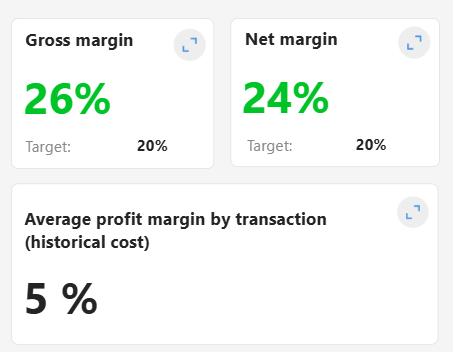
Average Profit per Transaction
You hit your sales goal—but did you make money?
This KPI shows whether a profit or loss was made on each transaction. It pulls each vehicle’s sales invoice and related costs to calculate the profit for every individual sale.
Note: This shouldn’t be confused with departmental margins and profitability (also available in Analytics), which factor in salaries, services, expenses, etc.
This detailed per-sale analysis includes:
- Historical cost
- Surcharges
- Discounts
- Importation costs
- Admin/registration fees
- Freight
- Other costs linked to the unit
The result is a real view of each vehicle’s profitability—how much money was made once all costs and expenses are subtracted.
You can identify which models are most profitable, and analyze profitability across the dealership, or by store, brand, sales rep, or model.
You can also spot sales reps who have a high sales volume but frequent discounts—generating lower average profit per sale. With this data, the dealership can decide whether to prioritize volume or higher margins.
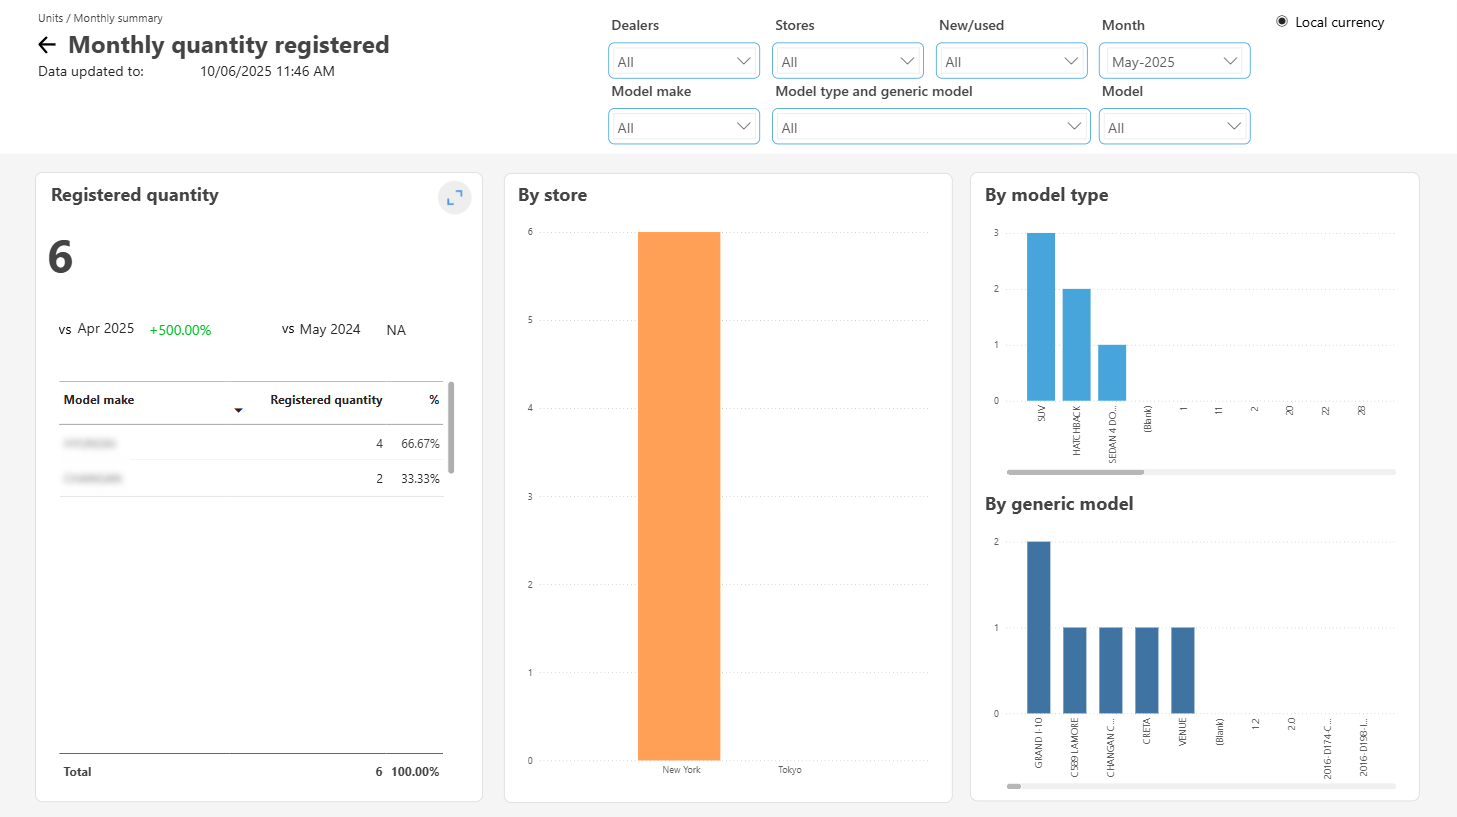
Vehicle Registrations
The Sales Dashboard already includes sales by amount and volume.
Now, a new section has been added to track vehicle registrations within a given period. This data is essential for measuring compliance with factory targets, for example.
Information is grouped by dealership, model, and generic model, allowing users to drill down and view full details of each registered vehicle or machine.
Filters allow you to segment data by dealership, store, business unit (new or used), brand, model, and generic model.
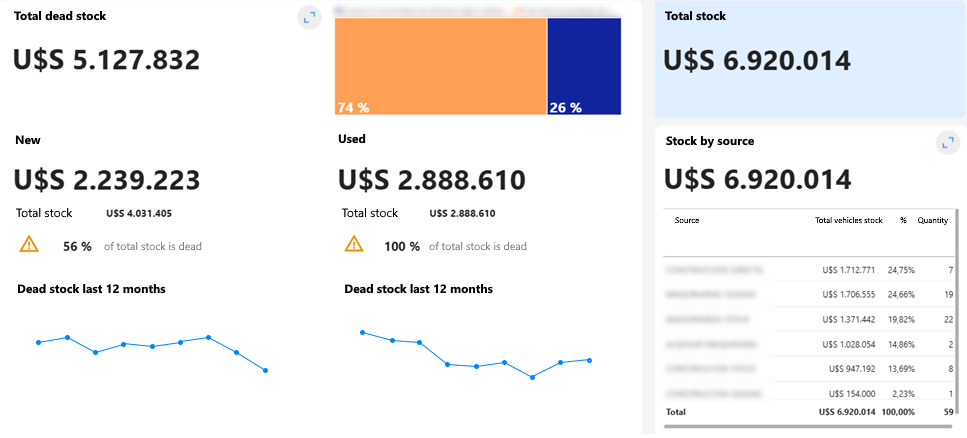
Vehicle Inventory and Aging
This dashboard shows the total vehicle inventory at a dealership or a store—and, more importantly, highlights what portion of that stock is currently immobilized.
Dealers can define how many days must pass before a vehicle is considered immobilized; Analytics automatically flags units that meet the criteria.
The information is split into new and used units, as aging conditions typically differ. You can also view exactly which vehicles are affected and sort them by time in stock.
This gives clear visibility into stock aging, so you can focus on the units that have been stagnant the longest.
Take Action
With this data, you can plan targeted sales campaigns to move stagnant vehicles that are costing money and losing value.
If you’re interested in learning more about these dashboards, feel free to contact us to schedule a personalized presentation.