In large dealer groups or multi-store dealerships, understanding the true performance of each location is no easy task. In fact, you’ve probably asked yourself: Which locations are selling the most? Which ones have the best expense-to-sales ratio? Who are the top-performing salespeople?
The hardest step is admitting that, in some cases, you don’t have clear answers to those and other key questions. What comes next is challenging, but far from impossible.
“Most people spend more time and energy going around problems than trying to solve them.”
—Henry Ford
The Formula for Turning Questions into Action
Step one: having the data
You need to record everything that happens in each department, every transaction in every corner of the dealership. Do you have a DMS? Then you’ve already taken the first step.
Step two: making the data clear, organized, and trustworthy
There’s a big difference between having endless spreadsheets and being able to see KPIs and metrics that actually mean something.
Step three: managing based on that information
In today’s industry, making decisions based on assumptions is no longer acceptable. Sometimes a general manager thinks a location is doing fine, only to find out—too late—that it’s bleeding money. Other times, a low-profile location turns out to have outstanding profitability when seen through the lens of data.
Taking Action Has Its Rewards
Data analysis means nothing if it doesn’t drive action. No one hands out trophies to spreadsheets—but they do to general managers who transform store performance through small, smart decisions hidden in the data.
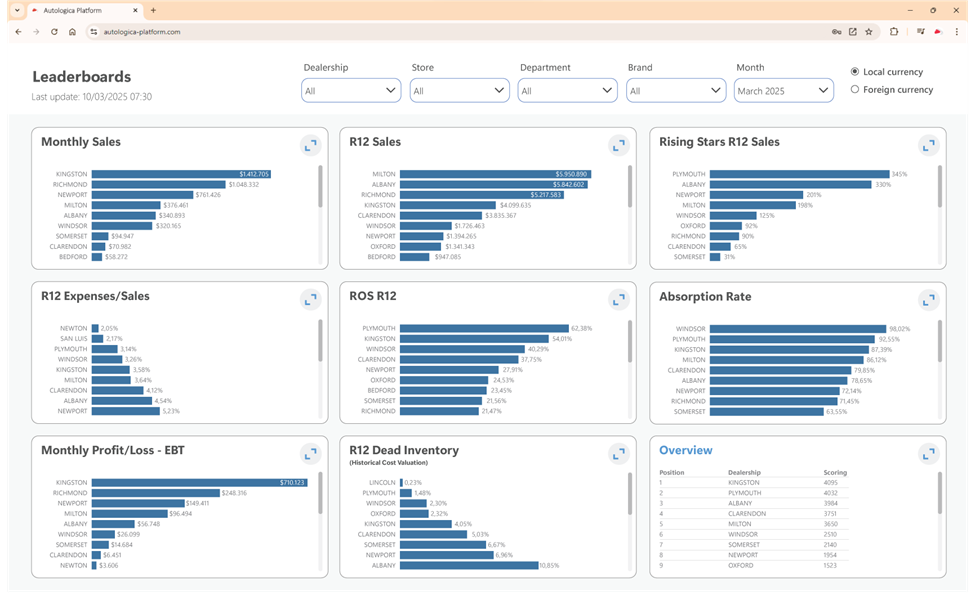
This is where the concept of Leaderboards comes into play—tools that measure performance using the same standards across locations, dealer groups, or even entire dealer networks.
Once your data is reliable and available in clear, actionable dashboards, you can start improving individual locations. And when that’s scaled across multiple locations or even dealers in different countries—you can turn the game on its head and transform an entire region.
A general manager’s Monday can start with clarity. It’s 8:30 a.m., they open their laptop, and with just a few clicks, they get a first look at the business:
• Which location is leading in sales this month and over the past 12 months.
• Which locatiosn are showing steady growth.
• Which salesperson is leading in sales and could inspire the rest of the team.
This is the kind of data that’s updated daily—perfect for tracking what’s moving the needle.
Then, once the month closes, they can dive deeper:
• Which locations are the most profitable.
• Where stock is being managed efficiently… and where idle inventory is worth an alarmingly high amount.
• Which managers are implementing the best strategies to improve absorption rate.
• Which expenses are exceeding limits across the business.
• Identify top performers and replicate their best practices across other teams.
This doesn’t replace visiting stores or meeting with managers, but it does provide a daily, complete overview of the business—without waiting on reports or email attachments.
When There’s Data, There Are No Excuses
If someone asked you one of the key performance questions mentioned above… could you answer it in a few clicks?
That speed is what separates business as usual from breakthrough performance.