In this article, we explore brief stories where data and context helped improve dealership performance, striking the perfect balance between measurement and decision-making.
Sales Drop, Margins Improve?
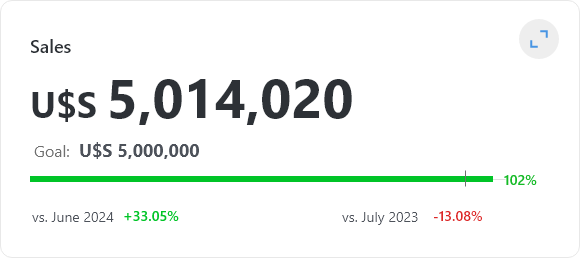
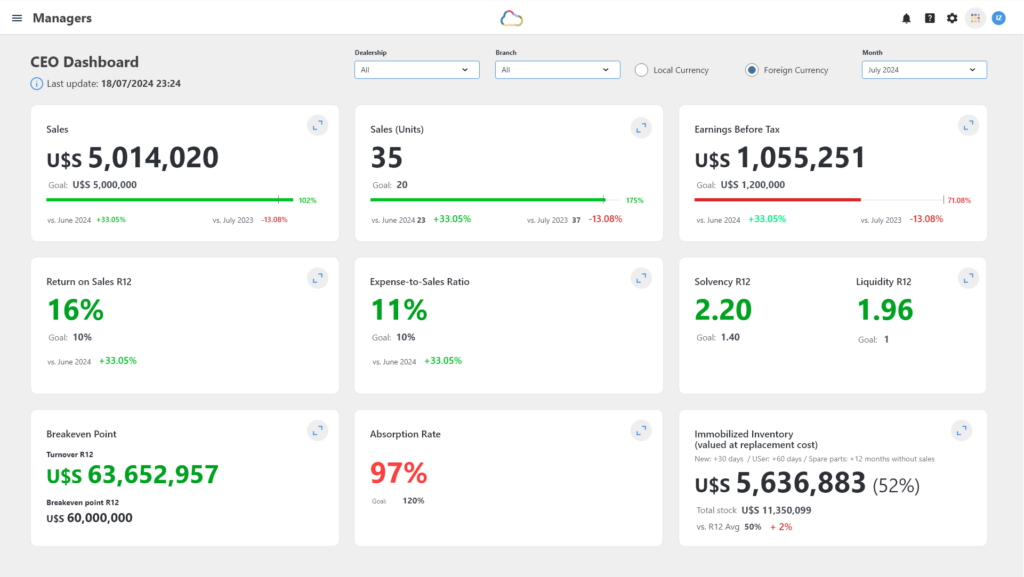
This scenario begins with a CEO almost spitting out his coffee when he was told that monthly sales had dropped by 40% compared to the previous month. That brief message nearly ruined his day (or his month) until he decided to analyze the context.
Although the sales drop was concerning, several factors helped put the situation into perspective:
- The monthly sales target was reached despite the decline.
- The previous month had been exceptional, with a surge of work in the service department due to the holiday season approaching.
- Gross and net margins exceeded targets thanks to cost-reduction strategies implemented in each department.
- In the Service Department, for example, technicians were trained to handle jobs that were previously outsourced, significantly reducing monthly costs.
While the sales indicator was in red, this context allowed for more informed decision-making, avoiding a knee-jerk reaction.
In Aftersales… Which Department Drives Sales?
This dealership’s service department generates $480,000 per month in parts sales and $180,000 in labor, meaning they sell $2.60 in parts for every dollar of labor.
By measuring the Parts to Labor Ratio, the dealership discovered something that had previously gone unnoticed: whether the Aftersales Department relied more on parts sales, services (labor), or if there was a balance between the two.
The conclusions were clear:
- The department primarily depended on parts sales.
- Service advisors weren’t generating additional jobs for each vehicle that entered the shop.
The manager’s goal was to increase labor revenue. To achieve this, they focused on increasing preventive maintenance jobs and set a target for each advisor: to complete more than one job per repair order. After implementing this strategy, the indicator reached a balance.
Are Technicians Making the Most of Their 8-Hour Day?
A Service Manager faced a critical situation: all the workshop bays were occupied, yet revenue didn’t meet expectations. To address this issue analytically, the manager began tracking two key indicators:
- Productivity: measuring how many of the 176 hours each technician worked per month were spent on billable tasks.
- Efficiency: calculating the ratio between billable hours and hours worked, allowing the manager to gauge each technician’s ability to generate revenue.
Noticing that both indicators were below expectations (technicians had idle time and weren’t working efficiently), the manager made important decisions:
- Leverage experience: identified the most productive and efficient technician and aimed to replicate their best practices across the team.
- Train the team: invested in staggered training sessions to improve the technicians’ skills without disrupting workflow.
- Improve time tracking: implemented touchscreen devices connected to the DMS so technicians could log their hours in real time, allowing for more accurate tracking of their work.
Conclusion
The indicators analyzed in these stories are essential for understanding the status of key departments such as Aftersales. Dealerships striving for success constantly review these metrics and look for ways to improve them.


