Searching through emails for the right attachment; digging through your downloads folder to find the most up-to-date spreadsheet among dozens of files; asking each manager—again—what the sales figures for the month were… these situations are not only frustrating but also major time wasters, and, more importantly, completely avoidable. How?
This is not how someone responsible for making strategic decisions should start their day.

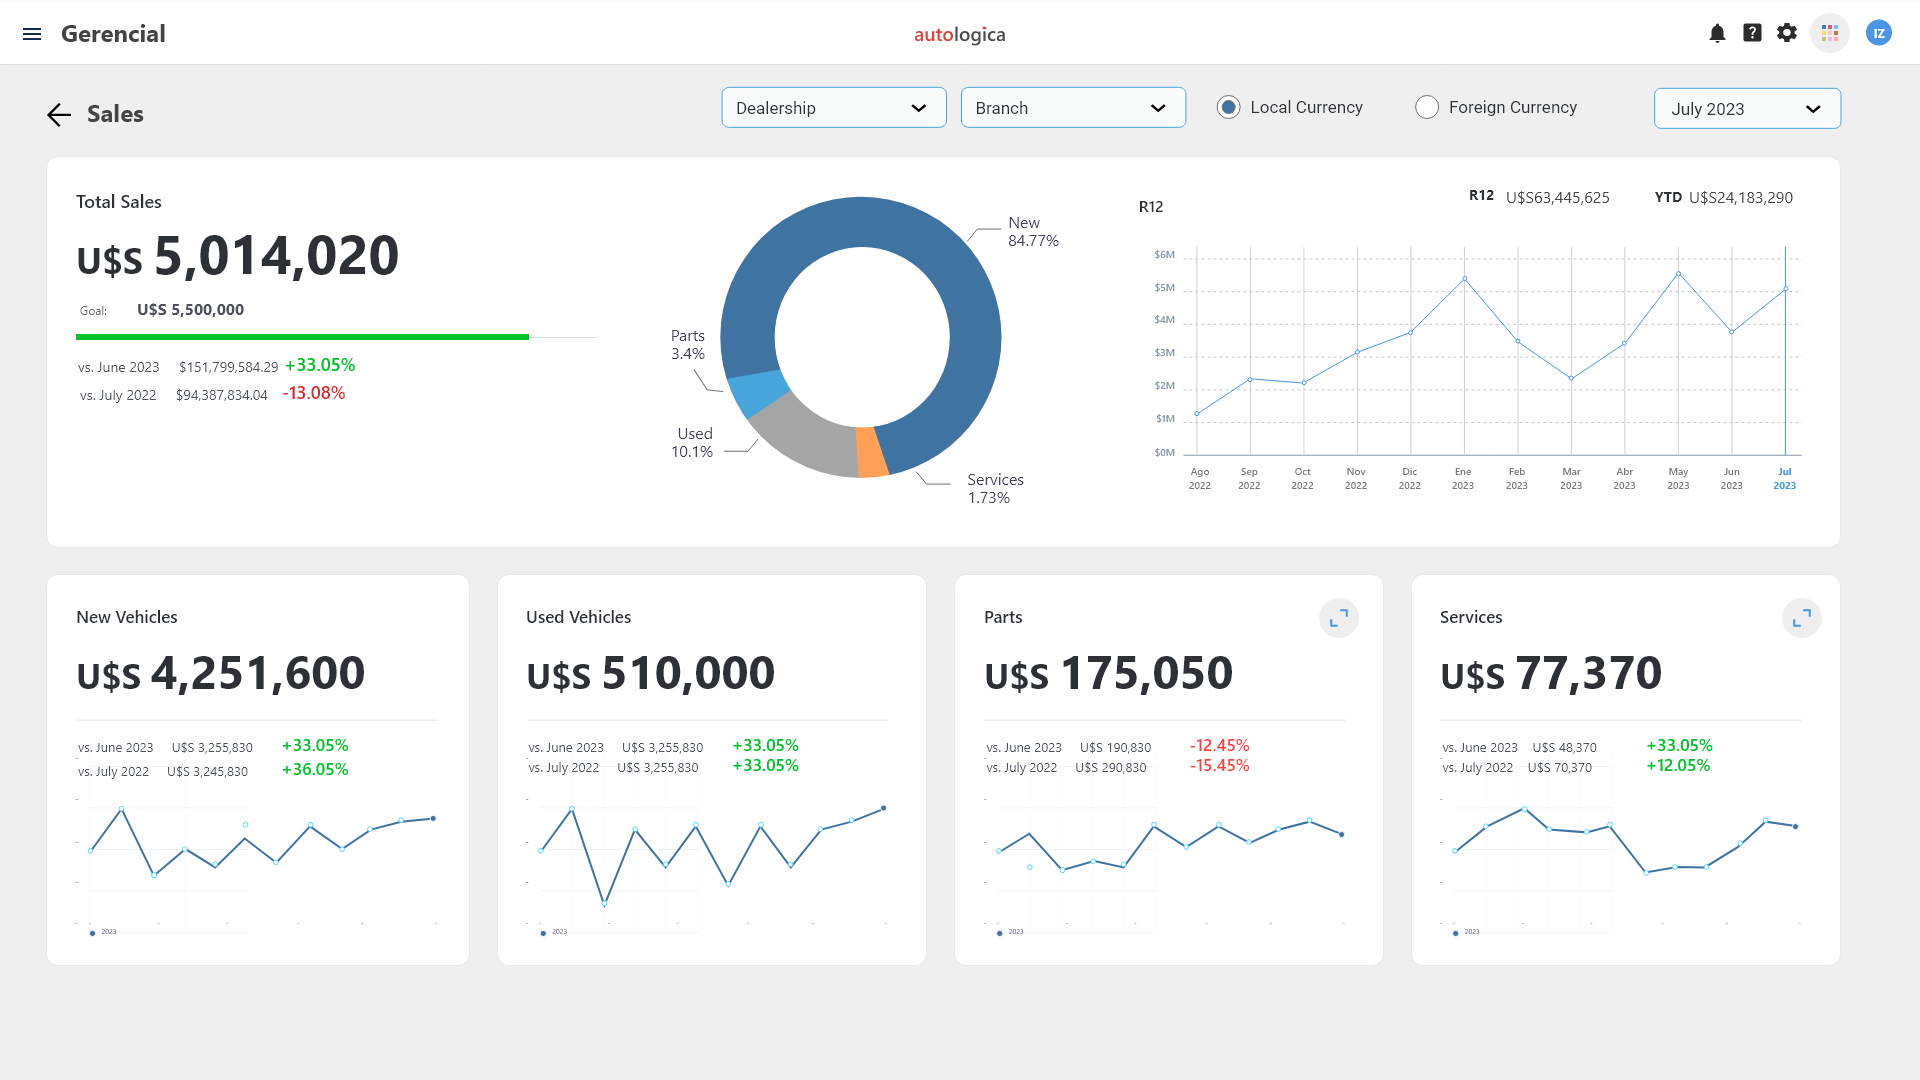
Now, picture a different start each morning:
Lack of Data Access Is the Biggest Barrier to a Data-Driven Culture
At the beginning of the year, companies usually set up spreadsheets to track KPIs, aligning them with business goals and hoping they’ll drive meaningful change. For the first few months, these spreadsheets are filled out religiously. But over time, empty cells start to appear because the data is hard to calculate, takes too much time, the volume is overwhelming, or it all needs to be done manually.
This is exactly the problem that tools like Autologica Analytics solve. Everything done in the DMS across all departments automatically feeds into the dashboards that managers review each morning and present to the CEO and principals.
When managers start calculating the time wasted on manually building KPIs—knowing that this task could be automated—it often leads to more than a little anxiety.
Data Must Be Accessible, Immediate, and Reliable
The success of any data analytics tool depends on this triad: data must be accessible, immediate, and reliable. These three elements must coexist in balance. If the data is accurate but hard to access, it’s useless. If it’s easy to access but unreliable, it’s equally worthless.
The Importance of Contextualizing Data
Another challenge, beyond the clutter of spreadsheets, is the difficulty of contextualizing indicators from different departments to draw meaningful conclusions with Excel.
It’s crucial to understand that KPIs are interconnected. For example, a dealership may have increased its revenue, but if it hasn’t met its Return on Sales (ROS) target, it might mean that while revenue grew, expenses ballooned, cutting into profit margins. As a result, the dealership’s profitability per dollar earned may be low.
Many KPIs are linked in this way, and tools like Autologica Sky DMS, with its integrated analytics, make it easier to interpret and understand these connections.
Do You Still Want to Rely on Spreadsheets?
Every file you search for and open is time that could be spent developing customer retention strategies. Every minute spent waiting for an email with the right data is time that could be used to explore new business opportunities. The difference between a desk cluttered with files and a screen summarizing your dealership’s performance isn’t just about convenience—it’s about investing the most valuable resource (time) in tasks that generate the best results (profitability).