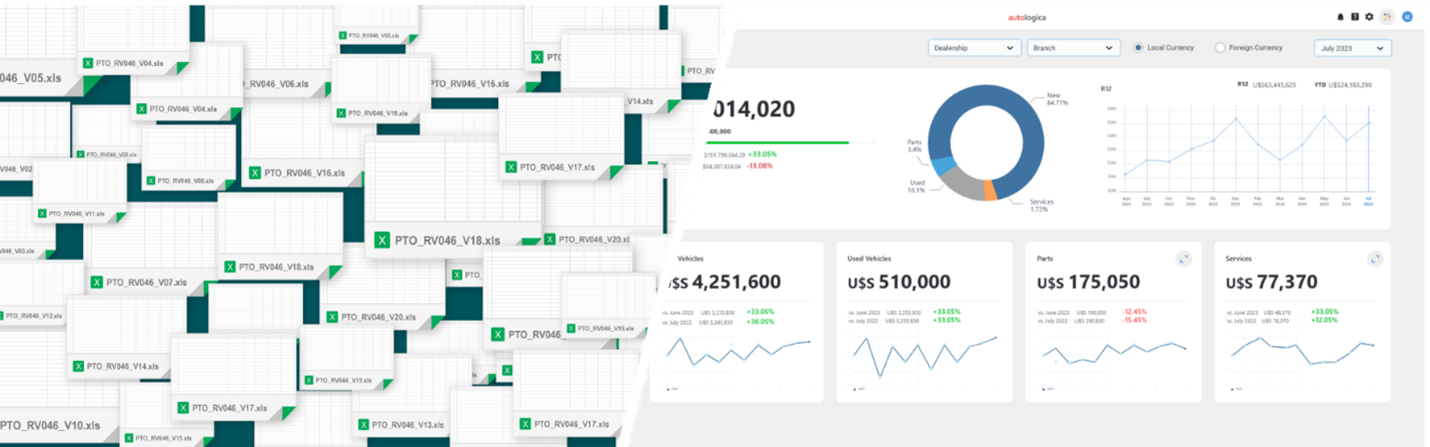
Traditionally, a manager would have to wait until the end of the month to request a series of reports to review what had already happened in the dealership.
Now, with the new version of Autologica Sky DMS that includes integrated analytics, dealership CEOs and department managers can access their daily performance dashboard to quickly identify the actions needed to stay on track. They can also dive deeper into each metric for more detailed insights.
“We want each manager to have a tool that supports them in their role, allowing them to step back from the day-to-day operations of the dealership to better monitor their department and plan strategically.” — Alfredo McClymont, CEO of Autologica.
A Different Approach to Start the Day
No more juggling multiple spreadsheets, waiting for information, or calling other managers to verify data. The CEO, department managers, and team leaders can now access key information with relevant KPIs and track each department’s progress toward its goals.
Dashboards Designed for Each Manager’s Needs
One of the strengths of integrated analytics is that each dealership can define who can use the tool and what dashboards each user will see. A CEO can easily view the following each morning just by opening Autologica in their browser:
- Total sales
- Sales by department
- Leaderboards: comparisons between dealerships, branches, and employees
- Earnings before Tax
- Budget control
- Solvency
- Liquidity
- Expenses-to-sales ratio
- ROS (Return on Sales)
- Breakeven point
- Absorption rate
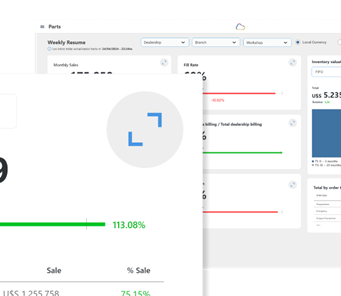
In contrast, a Service Manager will have a dashboard focusing on department-specific metrics, such as:
- Service sales
- Sales composition (customer, warranty, internal, or courtesy)
- Billable hours
- Efficiency and productivity
- Absorption rate
- Budget control
- Workshop visits
- Parts-to-labor ratio
- Worked hours vs non-billable hours
- Margins
- And more…
Analysis on Multiple Levels
Another key feature is the ability to drill down into the data. Unlike a static view, Autologica’s data platform allows users to explore each metric in-depth to several levels, in order to better understand the data composition.
This is crucial for analyzing the causes behind each result.